Power BI vs Tableau in 2025: Which Should You Learn for Better Data Career Opportunities?
Introduction
If you're an aspiring or practicing data analyst in 2025, you’ve likely asked yourself this question: Should I learn Power BI or Tableau? Both are powerful tools for data visualization and business intelligence — but they serve different needs, industries, and skill profiles. In this guide, we'll break down the core differences, career implications, and real-world use cases to help you choose the right tool for your data journey.
At a Glance: Power BI vs Tableau
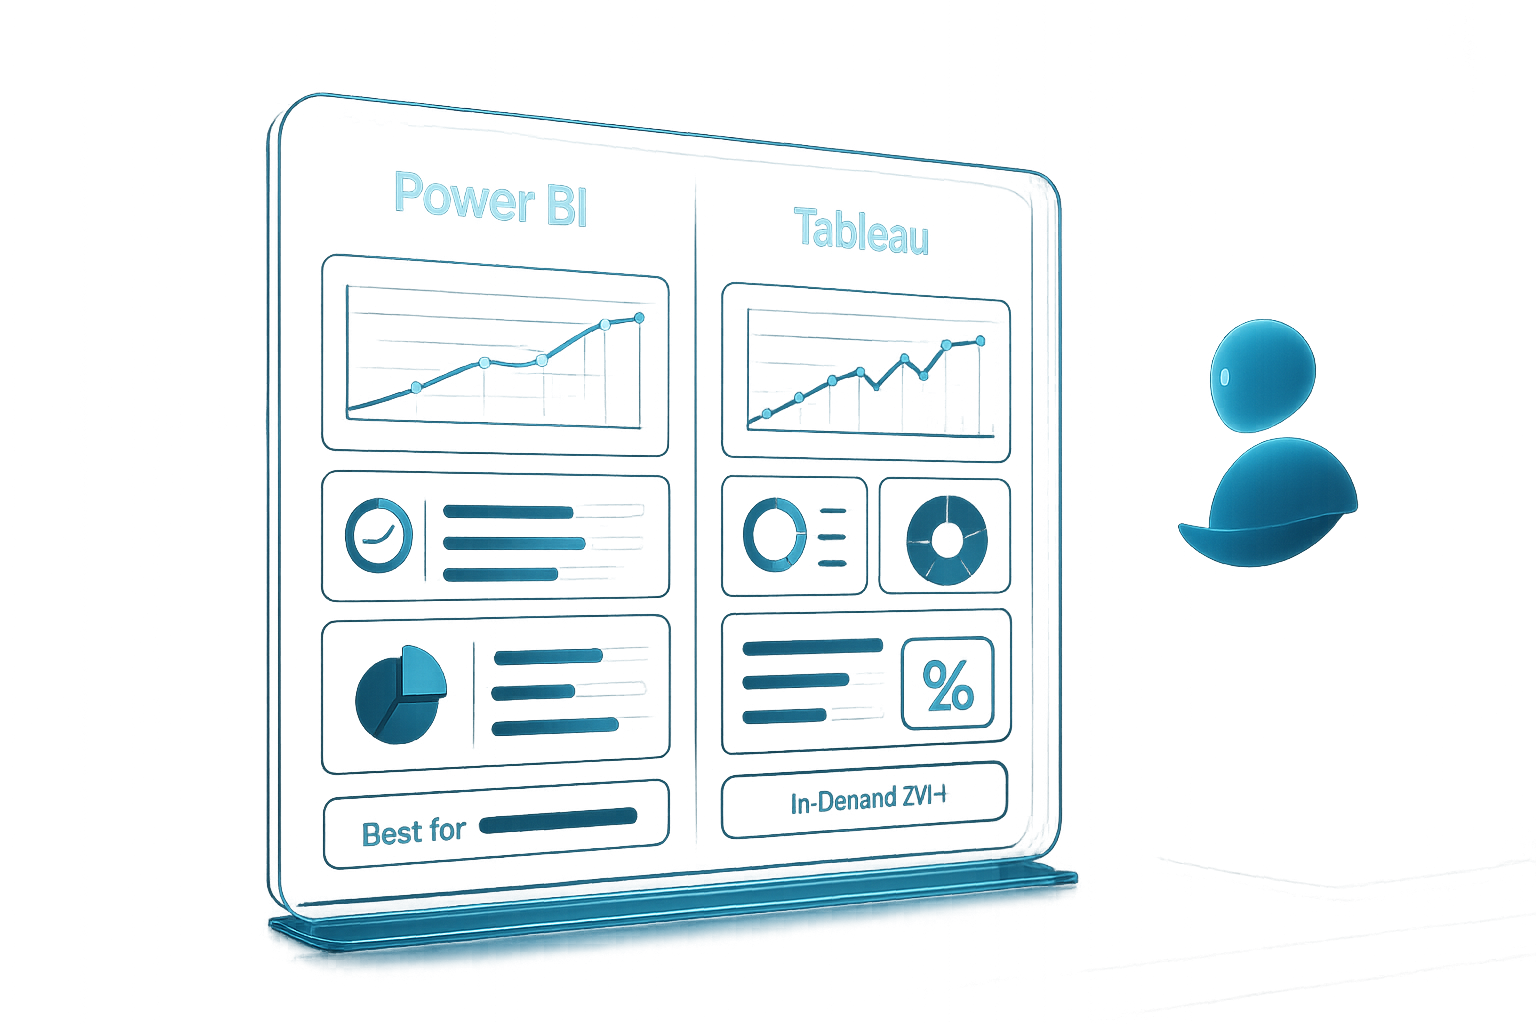
Learning Curve: Power BI is beginner-friendly, while Tableau has a steeper learning curve.
Integration: Power BI integrates seamlessly with Microsoft tools like Excel, Azure, and Teams. Tableau offers flexibility across platforms.
Pricing: Power BI is more affordable, while Tableau is typically costlier for enterprises.
Ideal For: Power BI is great for Excel users and business analysts. Tableau suits data scientists and design-heavy teams.
Community: Power BI has a massive enterprise BI community; Tableau thrives in data science circles.
Who’s Hiring for Each Tool?
Power BI
Most commonly requested in roles like:
Business Analyst
BI Developer
Financial Analyst
Top industries:
Consulting
Finance
Government & Public Sector
Tableau
Common in:
Data Scientist
Marketing Analyst
Data Visualization Specialist
Top industries:
Tech startups
Digital marketing
Healthcare analytics
Learning Power BI in 2025
Power BI remains one of the most accessible tools for analysts who are already familiar with Excel. Microsoft’s ecosystem makes it easy to integrate Power BI into your existing workflow. With low-code functionality and drag-and-drop dashboards, it’s the go-to tool for entry-level BI professionals.
Learning Resources:
Microsoft Learn
YouTube tutorials
Softcraft Studio’s BI Micro-Course: "Building KPI Dashboards That Drive Real Decisions"
Learning Tableau in 2025
Tableau is known for its design flexibility and ability to handle large-scale, multi-source datasets. While it has a steeper learning curve, it’s preferred in industries where presentation and exploration of data is a priority.
Learning Resources:
Tableau Public
Udemy / Coursera courses
Industry blogs & dashboards on Tableau Public
Salary Snapshot
Data Analyst: $85,000 — Tool Preferred: Power BI
BI Developer: $95,000 — Tool Preferred: Power BI / Tableau
Data Scientist: $110,000 — Tool Preferred: Tableau
Analytics Manager: $120,000+ — Tool Preferred: Both
💵 All salary estimates are in USD and based on U.S. market averages from LinkedIn and Glassdoor (2024–2025 data).
Final Verdict: Which Should You Learn?
If you're starting in Excel-heavy environments or want a smoother learning curve: Go with Power BI.
If you're aiming to work in visual-heavy fields, storytelling with data, or advanced analytics: Tableau might be worth the extra investment.
🎓 Pro Tip: Mastering just one tool deeply is better than knowing both superficially.
Bonus: Learn Both (Strategically)
Many employers today value analysts who can work cross-platform. Here’s how you can approach learning both:
Start with Power BI for fundamentals and dashboarding.
Add Tableau for advanced interactivity and visual storytelling.
Get Started with Analyst-Ready Templates
Make your learning faster with our plug-and-play dashboard templates:
✅ Power BI Templates for Beginners
✅ Tableau Starter Dashboards
✅ Analyst Onboarding Packs
Related Resources
Stay in the Loop
Join our community of data analysts and get updates on new micro-courses, templates, and tips. Follow us on our socials.

